Condensation
The Materials Manager opens Condensation for selected construction. It is used to display condensation data for selected constructions.

For the condensation calculations, the thermal resistance is computed for each layer, enabling interstitial temperatures to be found. Inside and outside conditions are used to compute vapor pressures. The vapor pressure gradient is then computed. The calculation is based on the assumption that condensation occurs at interfaces between material layers. The calculation also computes the amount of water deposited at interfaces during a 60 day winter period. If it is found that condensation occurs within a construction the program recalculates the dew point temperature so that the actual and dew point temperature curves just touch but do not cross. As this touching of lines is often difficult to see graphically, OpenBuildings Station Designer displays the temperature curves before the recalculation to denote condensation risk.
| Setting | Description |
|---|---|
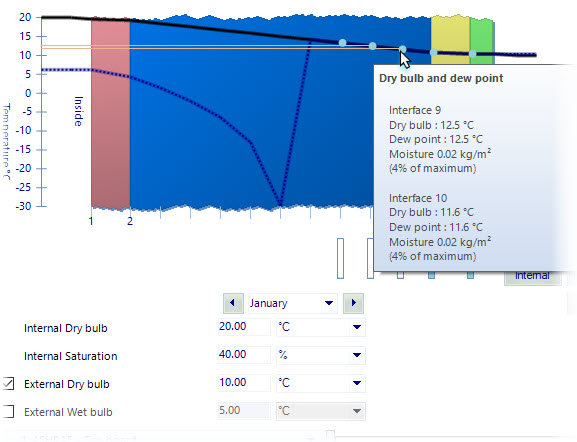
| Graph | When a construction is selected, a condensation
calculation is made, and a scaled graph of the construction is displayed,
showing the actual temperature distribution and the dew point temperature
distribution. If the dew point line touches or crosses the actual temperature
line, then condensation will occur.
|
| Month | Used to select a month for which to calculate and display condensation data. Condensation in the construction throughout the year is checked. The method involves calculating the condensation or evaporation at each node in the structure for each month of the year and keeping track of accumulated moisture in the construction. |
| Up | Used to update the condensation data when upward heat flow occurs. |
| Down | Used to update the condensation data when downward heat flow occurs. |
| Internal | Used to update the condensation data when heat flow occurs from the inside towards the outside. |
| Horizontal | Used to update the condensation data when horizontal heat flow occurs. |
| External | Used to update the condensation data when heat flow occurs from the outside towards the inside. |
| Internal Dry Bulb | Sets the internal dray bulb temperature. |
| Internal Saturation | Sets the percentage value for internal saturation. |
| External Dry Bulb | When checked, you can set the external dray bulb temperature here. |
| External Wet Bulb | When checked, you can set the external wet bulb temperature here. |
| Layers | Displays inside and outside dry bulb and dew point
temperatures for individual material layers that make up the selected
construction definition.
|
| Condensation table | Condensation in the construction throughout the year is checked. The calculation involves calculating the condensation or evaporation at each node in the construction structure for each month of the year and keeping track of accumulated moisture in the construction. The table rows populate when there is condensation where dray bulb and dew point graph line meet. |